NetSuite Analytics Warehouse Tour
Pre-built data pipelines, a business-language semantic layer, and cross-source dashboards. What NetSuite Analytics Warehouse adds beyond built-in reporting.
About this episode
Analysis starts already loaded here: pre-built pipelines move NetSuite data, custom fields included, into a warehouse whose semantic model uses business language instead of database fields.
The walkthrough stays concrete, adding a formatting rule that flags invoices over $1,000 in red, blending Google Analytics page views with NetSuite revenue through one of the 25-plus pre-built connectors, and running a machine learning Explain analysis as a starting point for investigating that mash-up. A pass through the 40-plus visualization palette uses scatter charts, trendlines, reference lines, and outlier detection to surface items whose revenue lags their page views, and a saved sales-and-profitability project breaks performance down by segment, customer type, and region, ending with a natural-language summary generated from the raw data.
Talk to a NetSuite consultant
Questions about what you just watched? A 30-minute call with our team gets you straight answers on your own setup.
Book a call00:00foreign of the netsuite analytics Warehouse when I log into the warehouse we can see that our netsuite data has already been populated pre-built data pipes automatically transfer the netsuite data into the warehouse and transform it into multi-dimensional objects for analysis let's open cache sales for example to do so I would typically click here but I've already opened this in another tab as you can see I have some analysis created but on the left hand side is the semantic model we've built that uses business language not database language to make it easier for us to find the data we need custom netsuite Fields can also be added to the warehouse and the pipeline calculates certain common measurements for us automatically I can navigate to my dashboards here which help me get started analyzing netsuite data faster these dashboards can be easily customized and new dashboards can be built without writing any code if I want to focus on something like overdue invoices
01:18I'll expand that analysis and collaborate with colleagues or even drill down further to take a deeper dive with only a couple quick keystrokes we can add formatting to focus our attention on specific data for example we can add a rule highlighting invoices over one thousand dollars in red as you can see the visualization is now focusing our attention on those records back on our data sets page we can create connections to other data sources there are over 25 pre-built connectors to other platforms such as Google analytics and Salesforce which allow us to more easily analyze all of our data for instance we'll bring in Google analytics data to mash up our page views with Revenue to see if there is any correlation here we can see netsuite actuals in the same data set as my website Analytics
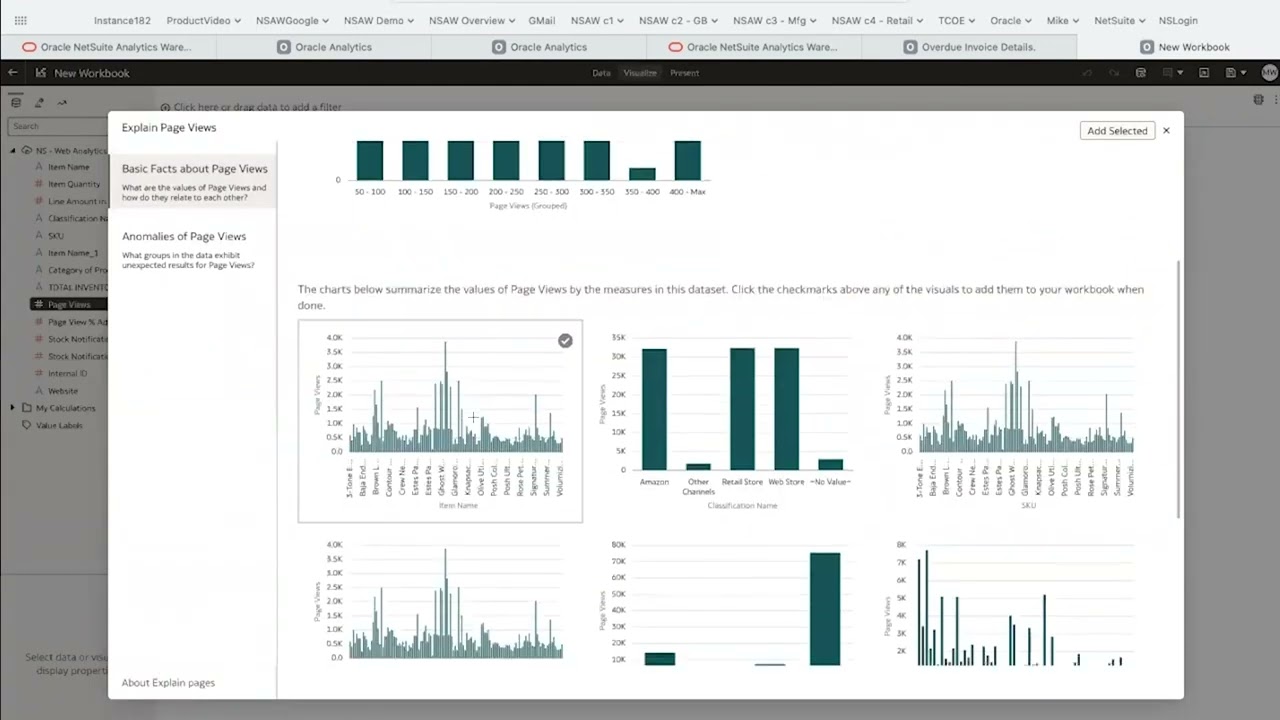
02:23I'll right click on explain page views and let machine learning give us a starting point to our analysis it can be run on all the data points in the data set as they relate to page views let's use this one based on item as a starting point now we'll drag our revenue from netsuite to see how that compares with paid views a palette of over 40 visualizations is available to help explore and understand the data in new ways a scatter chart for example is a great way to identify anomalies we can also add other machine learning features like a trendline illustrating the relation of the data based on a certain confidence or a reference line to compare against our average or perhaps there is just too much data and we need help identifying those outliers here we can see that there's an issue with the revenue these items are generating as it relates to page views so
03:29that's something we will want to investigate finally let's look at a real life sample of a project designed to analyze sales and profitability by navigating to our projects we can see all of our previously saved reports in this example we can focus our attention on the individual segment performance or we can Traverse these canvases and break down profitability and sales by category customer type or region the system can even translate raw data to complex to describe into natural language as shown here thank you for watching this demonstration if you have any questions please reach out to your account manager foreign