

NetSuite's standard reports are predefined templates that allow you to quickly generate reports on financial, inventory, sales and other data metrics. While a standard report can be a starting point for viewing and presenting your account's data, you may tailor it to suit your company's needs better.
Netsuite's customization empowers users to present and analyze data in a way that aligns with their unique reporting requirements.
We'll show you how to create custom reports in NetSuite below.
Consider Your Role Permissions
Before you can begin building custom reports in NetSuite, you may need to determine if you have access to customization features. Custom reporting in NetSuite can only be modified by users with Report Customization permission.
You will also need edit- or full-level access to preview, generate and save custom reports. You can view your permissions from the role definition page, located under the Setup tab.
If you do not have sufficient permissions to access and customize the report, you can reach out to your Netsuite administrator for the right course of action.
Launch the Report Builder
Once you have confirmed you have sufficient permissions to customize a standard report, launch the Report Builder by clicking the Customize button at the bottom left of the Reports page. From there, you will have various options for tailoring your report's content.
Navigate the Report Builder and Make Changes
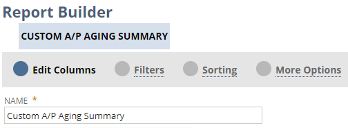
The Report Builder contains four different sections:
- Edit Columns
- Filters
- Sorting
- More Options
Note that the name of your report will default to “Custom” plus the report name, so it is best practice to retitle the customized report to something more specific and easily identifiable for your team.
Add, Remove or Move Columns
You can add, reorder or remove columns in NetSuite's Report Builder. To add a column, click Edit Columns on the Report Builder page. This will open an Add Fields pane on the left side. There, you will see fields that you can add to the report.
Click the fields you want to add to the report, and they will automatically display in the Report Preview pane. You can also add formula fields to your reports. These formulas are predefined, so you are unable to create your own SQL formulas. If you need to create a custom formula, you may want to use a saved search instead.
The Report Preview will show you the order the columns will display. Newly added columns are displayed last on a report. You can reorder columns to suit your desired sequence or remove columns you do not need.
You can change the order of columns by clicking on the column you wish to move in the Report Preview pane and then using the move buttons at the bottom to move the selected column left or right.
You'll also notice a Group with Previous Column checkbox next to the Move buttons. This option lets you group and display fields in a hierarchical structure. In this example, you can group the Item Name field with the Item Type field. The report will show each Item Type — Inventory and Non-Inventory — with all the items below it.
For fields that contain numeric data, you have additional column settings. You can drop decimals, divide by 1000, change how negative numbers display and add totals to the columns.
If you need to remove a column, click on the column you no longer want in your report and hit the Remove Column button at the bottom right of the Report Preview pane.
Add or Remove Filters
Under the Filters tab within the Report Builder, you can add and remove filters from the report. These filters will show at the bottom of your report and allow you to filter your data.
In the Add Fields pane, click the fields you want to add as a filter and then select the values that you want to filter on. If you want this filter to display at the bottom of the report, check “Yes” for Show in Filter Region in the Choose Filters pane. If you do not have this checked, the filter will still be applied but will not appear in the filter region.
In this example, the subsidiary shows in the filter field, so users can click the dropdown to run this report for different subsidiaries. The Account filter does not show at the bottom of the report but still restricts this report to include transactions that post to those three AP accounts.
To remove a filter, click the “X” next to it in the Choose Filters pane. Note that you'll only be able to remove custom filters.
Adjust Sorting Preferences
The Sorting tab allows you to remove default sorting settings or add new ones. It works similar to the Filters tab. You can select the fields that you want to sort your data on. The first field in the list will be sorted on first, followed by the second and so on. In this example, the report will be sorted by date and then alphabetically by the vendor names.
If you wish to remove a default sorting option, click the “X' next to it in the Choose Sort Order pane.
Review More Options
The More Options tab allows you to access additional settings and specify the users who can view the report. Here are some ways you can tailor your report via More Options:
- Show on Reports Page: Check the Show on Reports Page box to display the report in Saved Reports under the Reports dropdown.
- Allow Web Query: Select the Allow Web Query box to enable the report to be used for an Excel Web Query. This setting allows anyone who can access the report to export it and refresh the data within Microsoft Excel. It also allows users to share report data with people who do not have access to NetSuite. They can log in to the Excel file with a specified NetSuite username and password and refresh the data anytime outside of the system.
- Show Currency Symbol: The Show Currency Symbol checkbox enables you to display dollar signs or the respective currency symbols next to all amounts in your report.
- Drill Down Report: Select the detail report, which will display when a user clicks on a row in the report for drill downs. It will show the details of the transaction or underlying report.

Contact Luxent to Customize NetSuite ERP
Customizing NetSuite reports is one way to get more out of your investment. If you're interested in customizing other elements of NetSuite, such as adding functionality or integrating with third-party systems, consider our NetSuite Development and Integration services. Our development team can devise solutions to streamline your business processes within NetSuite and help ensure your company is maximizing NetSuite's advantages.
Regardless of where you are on your ERP journey, we can help your company make the most of NetSuite. As a NetSuite Solution Provider that cares about its customers, we look forward to partnering with you, whether you need assistance negotiating licensing, implementation or using NetSuite effectively.
Contact us or request a demo to learn more about NetSuite and our customer-first NetSuite services.